Monitor your services. Communicate status.
Checks from 10 global regions. Alerts only fire when multiple nodes confirm downtime. No false positives from Cloudflare blocks or single-region blips.
Checked from 10 regions. Confirmed before alerting.
Every check runs from multiple global locations simultaneously. We only alert when multiple regions confirm downtime — eliminating false positives from rate limiting, CDN edge issues, or regional network problems.
Free plan includes 2 regions (London + US East). Pro and Team plans include all 10 regions.
How it works
Four steps from signup to a live status page your users can trust.
Add a monitor
HTTP endpoint, database, TCP port, ICMP ping, or cron heartbeat. Pick your check regions.
We start checking
Checks run every 5 minutes from up to 10 global regions. Database monitors run SELECT 1.
Get alerted
Email, SMS, Slack, Discord, Teams, PagerDuty, Opsgenie, ntfy, and more. Auto-created incidents with escalation.
Share your status
A public status page with uptime bars, incident timeline, and subscriber notifications.
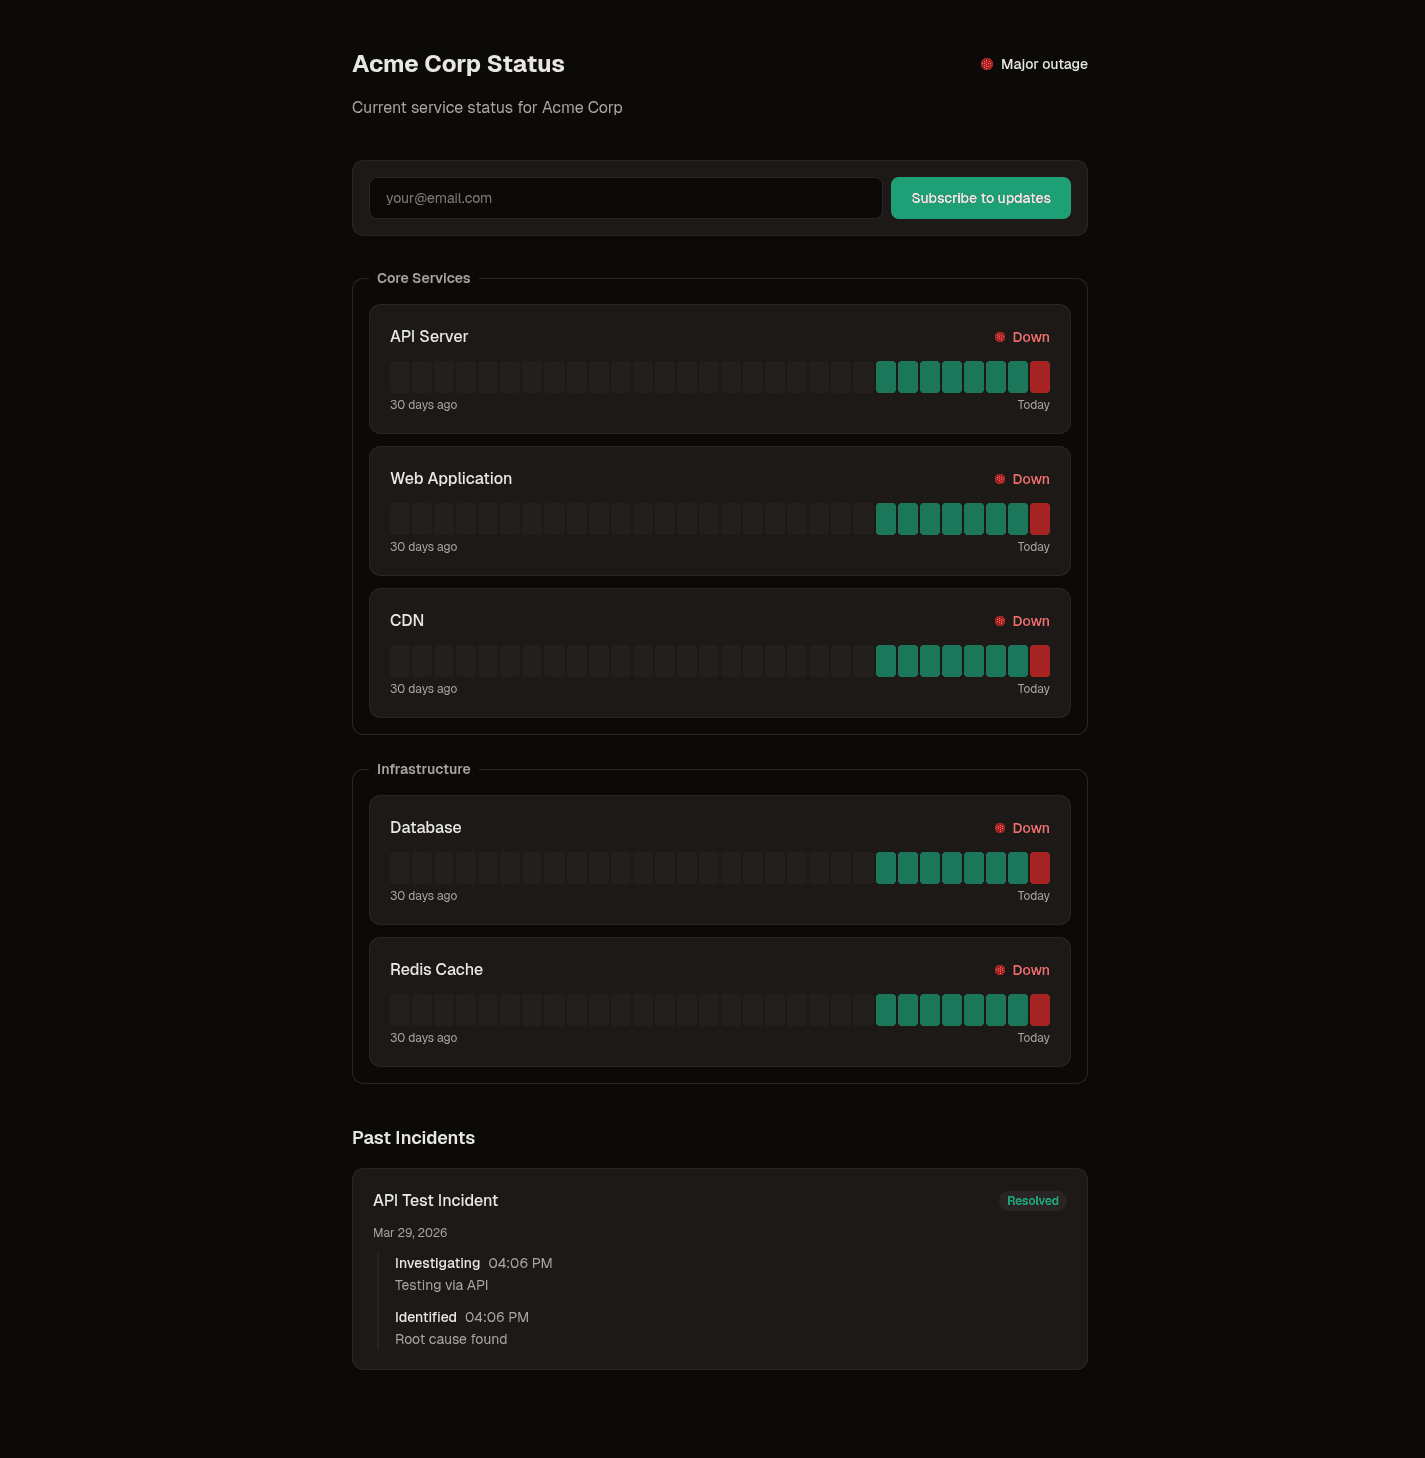
Status pages your users will actually trust
A clean, professional status page that shows real-time monitor status, 30-day uptime history, active incidents with timelines, and upcoming maintenance windows.
- Real-time updates — status changes instantly, no refresh
- Component groups to organise services
- Email subscriber notifications on incidents
- Custom domain support (status.yourdomain.com)
- Custom branding, favicon, and meta tags
- Embeddable uptime badges for READMEs
Everything you need to monitor and communicate
Monitor → Detect → Notify → Communicate. The complete loop for teams of 1‑10.
HTTP, TCP, Ping, DNS, Database & Cron monitoring
HTTP checks from 10 global regions. PostgreSQL and MySQL query checks. TCP port monitoring. ICMP ping. DNS record monitoring. Heartbeat/cron monitoring — your jobs ping us to prove they ran.
Real-time status pages
Status pages update instantly via WebSocket — no refresh needed. Visitors see monitor changes, new incidents, and maintenance updates live.
API health checks
HEAD, GET, POST, and PUT methods. Custom headers. JSON path, regex, and string matching. Multi-step API checks with variable extraction. Response time thresholds.
13 alert channels with escalation
Email, SMS, Slack, Discord, MS Teams, Google Chat, Mattermost, Rocket.Chat, ntfy, PagerDuty, Opsgenie, Incident.io, Webhook. Escalation chains with wait times.
Automatic incidents
Downtime detected? Incident auto-created, owner alerted, subscribers notified. False positive prevention with multi-region confirmation.
Incident communication
Post timestamped updates as you investigate. Subscribers see the full timeline — not just "down" and "up". Create, update, and resolve from the dashboard or API.
Custom domains & branding
Serve your status page from status.yourdomain.com. Custom logo, colours, favicon, meta tags. Remove OnePageStatus branding on paid plans.
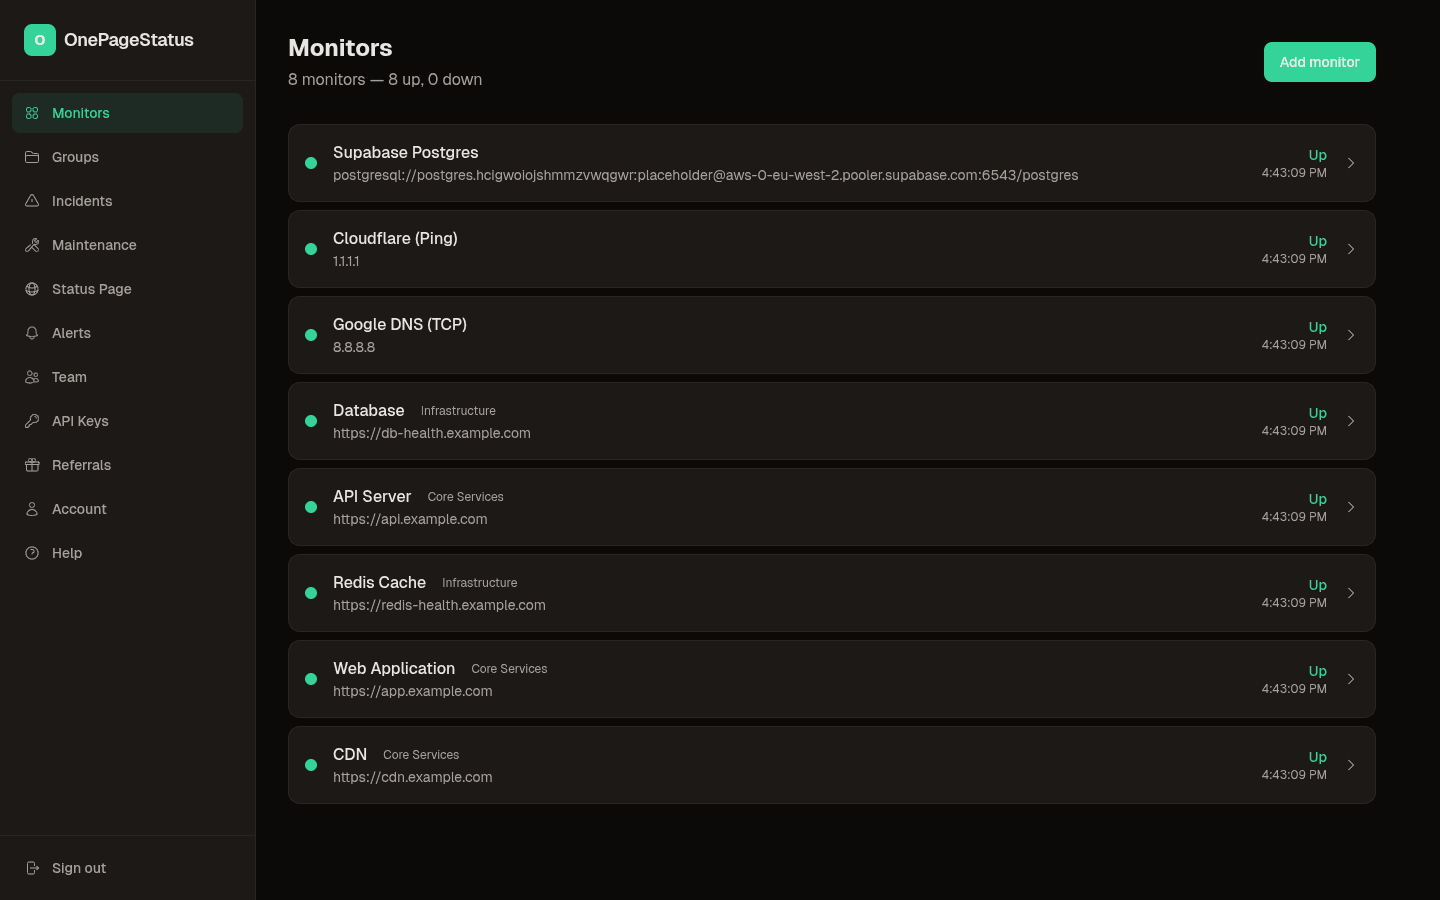
Dashboard & audit trail
Filter, sort, tag, and group monitors. Save views. Full activity log tracking who changed what, when — exportable as CSV for compliance.
SSL & domain expiry monitoring
Daily SSL cert checks with 14-day and 3-day expiry alerts. Domain registration expiry monitoring via RDAP — get warned at 30 days and 7 days before your domain lapses.
Scheduled maintenance
Announce maintenance windows in advance. Subscribers get notified. Shown above monitors on the status page. Updates in real-time.
SLA compliance tracking
Set uptime targets (e.g. 99.9%) per monitor. Track actual vs contractual SLA with visual gauges. Scheduled maintenance excluded from downtime.
Uptime history & annotations
View 7/30/60/90-day uptime trends. Export to CSV. Mark deploys, config changes, and external events on the timeline — annotations appear as flags on response time charts.
Subscriber notifications
Visitors subscribe via email with double opt-in. They get notified on incidents, updates, resolutions, and scheduled maintenance.
Team, API & referrals
Invite team members to share your dashboard. Programmatic API for monitors and incidents. Refer others and both get a month free.
Simple, transparent pricing
No per-seat pricing. No feature gating on essentials. Monitoring included on every plan.
Free
- 1 HTTP monitor
- 2 check regions
- 5-minute intervals
- Public status page
- 25 subscribers
- Auto incidents
- Email & SMS alerts
Pro
- 15 monitors
- HTTP, TCP, Ping, DNS, DB, Cron
- 10 check regions
- 30-second intervals
- 5 status pages
- Custom domains
- Unlimited subscribers
- SSL monitoring
- Email, SMS & webhook alerts
- JSON path, custom headers, response time thresholds
- Uptime badges
Team
- 50 monitors
- Everything in Pro
- Team members (viewer/editor/admin)
- Slack alerts
- API access
- 10 status pages
- Referral rewards
Enterprise
Need custom limits, SLA guarantees, SSO, dedicated infrastructure, or on-premise deployment?
Contact usWhy not just use...?
Most teams cobble together separate monitoring and status page tools. We built both in one.
| Feature | OnePageStatus | Atlassian Statuspage | UptimeRobot + Statuspage |
|---|---|---|---|
| Monitoring included | HTTP, TCP, Ping, DNS, DB, Cron | No | HTTP only |
| Alert channels | 13 channels — Email, SMS, Slack, Discord, Teams, PagerDuty, Opsgenie, Incident.io, ntfy, etc. | Email, Slack | Email only |
| Status page included | Yes | Yes | Separate tool |
| Monthly cost | From £12 | From $29 | $36+ |
| Unlimited subscribers | Yes (Pro) | 250 (Hobby) | Separate limits |
| Real-time updates | Yes — live WebSocket | No | No |
| Auto incidents | Yes | No | Manual only |
| SSL monitoring | Yes | No | Separate add-on |
| Custom domains | Yes (Pro) | Yes | Statuspage only |
| Setup time | 60 seconds | 30+ minutes | 1+ hours |
Start monitoring in 60 seconds
Enter a URL, pick a name, done. Your first status page is live before you finish your coffee.
Get started free